Historical simulation is one of the most misunderstood concepts in trading. Some traders treat it as near-certain proof of a strategy's worth. Others dismiss it as meaningless. Neither position holds up.
This article covers what historical simulation actually is, how it works inside AI trading systems, where it adds real value, and where it can lead you astray. If you regularly evaluate strategies based on past performance data, read this carefully.
Historical simulation — commonly called backtesting — is the process of running a trading strategy against past market data to measure how it would have performed. You define the rules, apply them to historical prices, and measure the outcome.
The operative phrase is "would have." Simulated results describe how a strategy behaved under past conditions. They say nothing definitive about future performance. That distinction matters every time you see a return figure attached to a strategy.
In AI trading, historical simulation serves a specific purpose: it gives you a data-backed starting point for evaluating whether a strategy's logic is coherent and whether its signals have shown any edge historically.
It starts with historical price data. For a simulation to mean anything, that data needs to be accurate, complete, and adjusted for corporate actions, splits, or delistings where applicable.
Poor data quality is one of the most common sources of misleading backtest results. Gaps, errors, or survivorship bias in the dataset can make a strategy look far stronger than it ever was in practice.
The strategy rules are then defined precisely — entry conditions, exit conditions, position sizing, and any applied filters. In AI-driven systems, these rules may be generated or refined by a model rather than manually coded, but they still need to be explicit and testable.
Strategies like Bollinger Band Breakout, MACD Trend, or ADX Trend Strength each have specific mathematical definitions. The simulation applies those definitions consistently across the full historical dataset.
The simulation engine steps through historical data bar by bar, applying the strategy rules as if trades were being placed in real time. Every entry, exit, win, and loss gets recorded. A well-constructed simulation only uses information that would have been available at each point — it never peeks ahead.
This is where the quality of the engine matters. A sloppy implementation introduces look-ahead bias, which produces results that no real-world execution could ever replicate.
Once the simulation completes, you get a set of performance metrics: cumulative return, win rate, drawdown, Sharpe ratio, and others depending on the platform. These numbers describe how the strategy performed on that specific dataset under those specific conditions — nothing more.
Without simulation, you are evaluating a strategy on theory alone. That is a thin foundation for any trading decision.
Simulation gives you a structured way to ask: has this strategy's logic produced positive results when applied to real historical market data? It does not answer whether it will work going forward, but it does tell you whether the underlying rules have shown a coherent edge in the past.
For AI-generated strategies, this filter is especially important. AI models can produce a large number of strategy variations quickly. Historical simulation separates those with documented historical performance from those with no track record at all.
It also makes comparison possible. When multiple strategies are simulated on the same data using consistent methodology, you can rank them by performance and identify which approaches have historically been stronger. That is exactly what a transparent leaderboard model is built on.
Historical simulation is useful. It is not a prediction engine. These are the three failure modes worth knowing.
Overfitting happens when a strategy is tuned so precisely to past data that it performs well in simulation but falls apart in live conditions. Run enough variations of a strategy and keep the one that looks best, and you are almost certainly selecting for noise rather than a genuine edge.
Well-designed simulations guard against this through out-of-sample testing — developing the strategy on one portion of the data and validating it on a separate portion it has never been exposed to.
This occurs when the simulation uses information that would not have been available at the time of the trade. Even minor implementation errors can introduce it. The result is returns that look compelling but are impossible to replicate in practice.
Markets evolve. A strategy that performed well in a trending environment may behave very differently when conditions shift to range-bound or high-volatility. Historical simulation cannot tell you how a strategy will perform in a regime that has not yet occurred.
This is why no responsible platform presents simulated returns as a forecast. Past performance is not indicative of future results — that disclaimer exists because it is accurate.
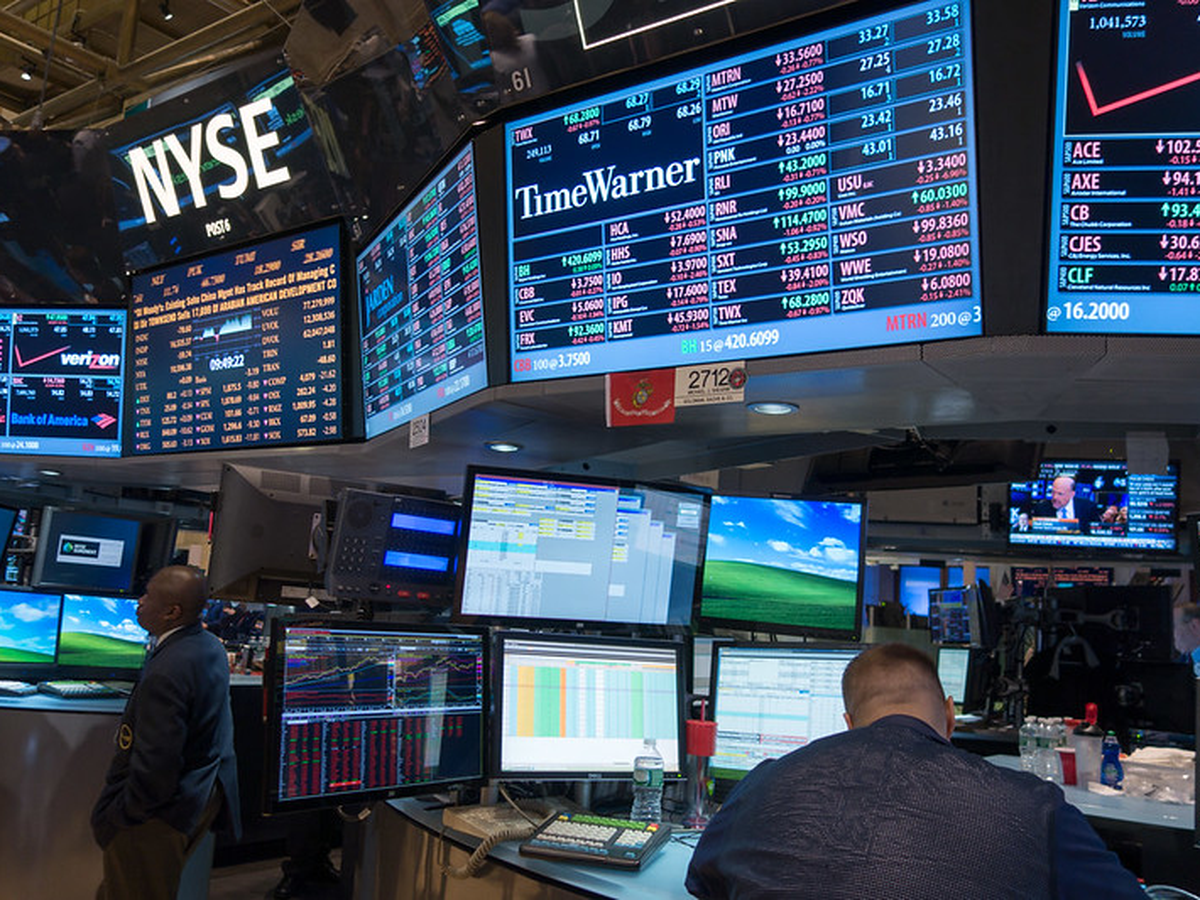
Trader.AI uses historical simulation as the foundation of its strategy evaluation process. Every AI trading bot on the platform has its performance metrics derived from backtesting on past market data — not from live trading results.
Strategies are powered by distinct AI models — GPT-5.2, DeepSeek Reasoner, and MiniMax-M2.1 — running across Forex, Crypto, Commodities, and Equities. Each bot operates a specific strategy type, and its cumulative return figures reflect how that strategy performed in historical simulation.
For example, Slade-0xBE runs Candlestick Pattern Recognition on Commodities via MiniMax-M2.1 and shows a cumulative simulated return of +31.2%. Revenant-0x00 uses Bollinger Band Breakout on Crypto via GPT-5.2 and shows +12.9%. These are historical simulation results. They inform your analysis. They do not predict what either bot will return going forward.
The leaderboard ranks bots by cumulative historical return, giving you a transparent, data-grounded way to compare strategy performance across markets and AI models. You can explore individual bot profiles with full strategy details, then make your own trading decisions from there. The analysis is automated. The decisions are yours.
Not all simulated results carry the same weight. When reviewing historical simulation data, these are the questions worth asking:
How long is the test period? A simulation spanning multiple market cycles is more informative than one covering a short, favorable window.
What is the drawdown? Cumulative return tells part of the story. Maximum drawdown tells you how much the strategy lost from peak to trough during the test period. A high return paired with a very high drawdown may not fit your risk tolerance.
How many trades were included? A strategy with 12 trades in a simulation carries far less statistical weight than one with 500. Small sample sizes produce unreliable averages.
Is the methodology consistent across strategies? When comparing strategies, the simulation methodology needs to be the same. Mixing results from different time periods or different data sources introduces noise that makes comparison meaningless.
What market conditions did the test cover? A simulation that only spans a bull market tells you nothing about how the strategy holds up in a downturn.
These questions apply whether you are evaluating strategies on Trader.AI or anywhere else. Simulated data is one input in your decision-making process — not a definitive verdict.
What is historical simulation in trading?
Historical simulation, also called backtesting, is the process of applying a trading strategy's rules to past market data to measure how it would have performed. The results reflect historical behavior under past conditions and do not predict future performance.
Is historical simulation the same as backtesting?
Yes. The terms are used interchangeably in most trading contexts. Both refer to running a defined strategy against historical price data to generate performance metrics.
Can historical simulation predict future trading results?
No. Historical simulation shows how a strategy performed under past market conditions. Past performance is not indicative of future results. Market conditions change, and simulated returns cannot account for conditions that have not yet occurred.
What is overfitting in historical simulation?
Overfitting occurs when a strategy is tuned too precisely to past data, producing strong simulation results that do not hold up in live trading. It is one of the most common pitfalls in strategy development and is addressed through out-of-sample testing.
What metrics should I review in a historical simulation?
Key metrics include cumulative return, maximum drawdown, win rate, number of trades, and risk-adjusted return measures such as the Sharpe ratio. Looking at multiple metrics gives a more complete picture than focusing on return alone.
How does AI change the historical simulation process?
AI models can generate, test, and refine strategy variations at scale, applying consistent rules across large datasets and surfacing patterns that manual analysis might miss. That said, the fundamental simulation methodology — and its limitations — remains the same regardless of whether a human or an AI model defines the strategy rules.
Why do platforms use leaderboards based on historical simulation?
Leaderboards ranked by historical simulation results offer a transparent, data-grounded way to compare strategies. They let traders evaluate relative performance across different approaches without relying on subjective claims or human signal providers.
Historical simulation is a tool, not a guarantee. Used correctly, it gives you a structured, data-backed way to evaluate whether a strategy's logic has shown any historical edge. Used carelessly, it creates false confidence in results that will not hold in live markets.
Treat simulated performance as one input among several. Understand the methodology behind the numbers. And keep the final trading decision where it belongs: with you.
Explore AI strategies ranked by historical simulation data at Trader.AI.
All performance figures referenced in this article are based on historical simulations. Past performance is not indicative of future results. Trading involves risk.