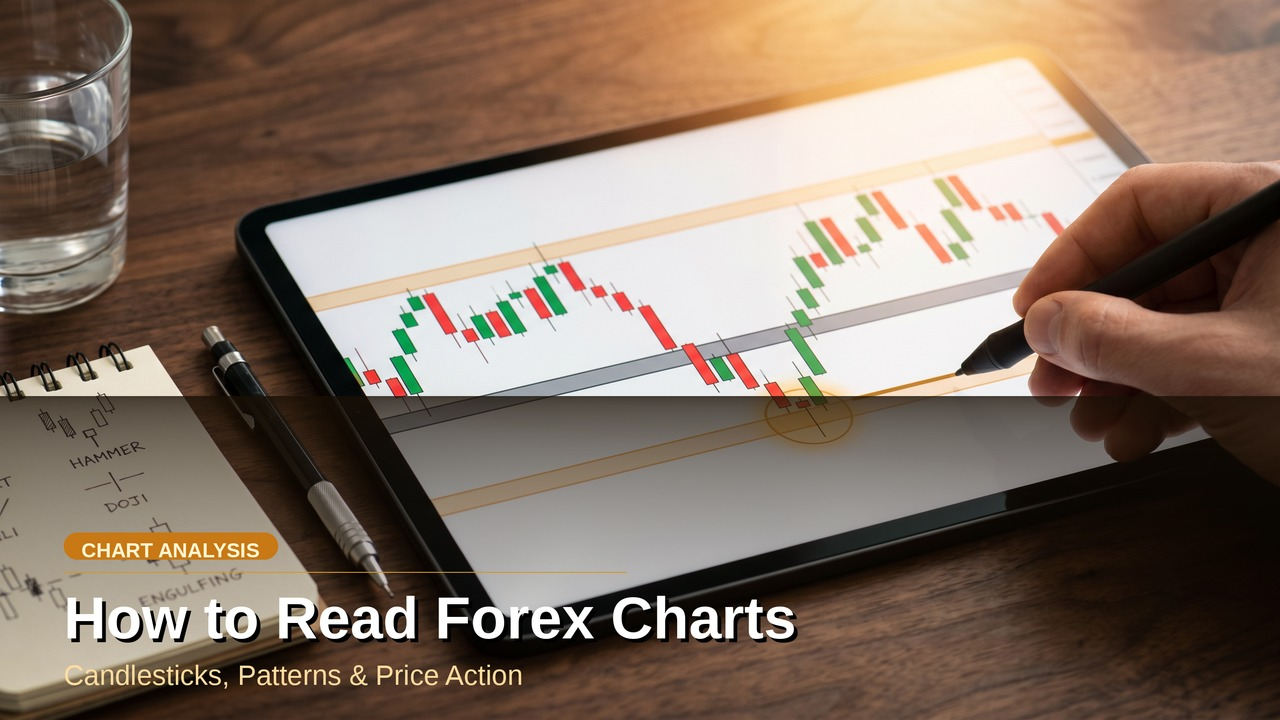
How to Read Forex Charts: Candlesticks, Patterns, and Price Action for Beginners
Learn how to read forex charts using candlestick patterns, support and resistance, and price action to build a strong foundation for your trading journey.

Learn how to read forex charts using candlestick patterns, support and resistance, and price action to build a strong foundation for your trading journey.
Every trade you place starts with a chart. Before you touch a single indicator or read an economic calendar, you need to understand what price is doing right now and what it has done before.
Forex charts are not just graphs. They are a visual record of every buy and sell decision made by every participant in the market. When you learn to read them properly, you stop guessing and start making decisions based on evidence.
This guide covers the essentials: chart types, candlestick anatomy, the most reliable patterns, support and resistance, and how to apply price action thinking to your analysis. If you are new to forex, start here.
Most trading platforms, including MetaTrader 5, give you three chart options. Each shows the same price data differently.
Line charts connect closing prices with a single line. They are clean and easy to read, but they hide a lot of information. You cannot see how price moved within a given period.
Bar charts show the open, high, low, and close (OHLC) for each time period. More information than a line chart, but harder to read quickly.
Candlestick charts show the same OHLC data as bar charts but in a visual format that makes patterns much easier to spot. This is the chart type used by the majority of active traders, and it is what you should focus on first.
Each candlestick represents a specific time period. On a 1-hour chart, one candle equals one hour of price movement. On a daily chart, one candle equals one full trading day.
A single candlestick has four data points:
The thick part of the candle is called the body. It shows the distance between the open and close. The thin lines above and below the body are called wicks (or shadows). They show the high and low extremes.
A bullish candle closes higher than it opens. On most platforms, it appears green or white. Buyers were in control during that period.
A bearish candle closes lower than it opens. It appears red or black. Sellers dominated.
The size of the body matters. A large body means strong momentum in one direction. A small body means indecision. Long wicks with a small body often signal a rejection of a price level — which is where patterns start to get interesting.
Candlestick patterns are combinations of one or more candles that signal a potential shift in momentum. None of them are 100% reliable. They work best when combined with context — like a key support or resistance level.
1. Doji
A candle where the open and close are almost identical, leaving a very small body. It signals indecision. When it appears after a strong trend, it can mean the move is losing energy.
2. Hammer
A candle with a small body near the top and a long lower wick. It appears after a downtrend and suggests buyers pushed back hard against selling pressure. A bullish reversal signal.
3. Shooting Star
The opposite of a hammer. Small body near the bottom, long upper wick. Appears after an uptrend. Sellers rejected higher prices — a bearish reversal signal.
4. Engulfing Pattern
Two candles. The second candle's body completely covers (engulfs) the first. A bullish engulfing pattern at a support level is a strong buy signal. A bearish engulfing at resistance is a strong sell signal.
5. Inside Bar
The second candle's high and low sit entirely within the first candle's range. It signals consolidation. Traders watch for a breakout in either direction after an inside bar.
Candlestick patterns become far more meaningful when you place them in the right context. That context is support and resistance.
Support is a price level where buying has historically been strong enough to stop price from falling further. Think of it as a floor. When price approaches support, traders look for bullish signals.
Resistance is the opposite — a ceiling where selling pressure has consistently pushed price back down. When price approaches resistance, traders look for bearish signals.
To identify these levels, look left on your chart. Find areas where price reversed multiple times. The more times a level has held, the more significant it is.
A few things to keep in mind:
Combining a candlestick reversal pattern with a strong support or resistance zone gives you a much higher-quality trade setup than either signal alone.
Price action trading means making decisions based on raw price movement — no indicators, no moving averages, no oscillators. Just the chart.
This does not mean indicators are useless. But for beginners, learning to read price action first builds a stronger foundation. You understand why price moves before you add tools that react to it.
The core habits of price action analysis:
Read the trend first. Is price making higher highs and higher lows? That is an uptrend. Lower highs and lower lows? Downtrend. Choppy and sideways? No clear trend — often better to wait.
Watch the closes. Where a candle closes relative to its range tells you who won that period. A candle that closes near its high shows buyers in control. A close near the low shows sellers.
Note the wicks. Long wicks show rejection. If price keeps pushing into a level and getting rejected with long wicks, that level is significant.
Check the volume context. On MT5, you can overlay volume. A breakout on high volume is more convincing than one on thin volume.
Price action is a skill that improves with screen time. The more charts you study, the faster your pattern recognition develops.
Ready to put this into practice? Open a free demo account at specmarkets.com and apply everything in this guide on live MT5 charts — with zero financial risk.
MetaTrader 5 is the platform of choice for most active forex traders, and it is the platform Spec Markets runs on. Here is how to use it to build your chart reading skills:
Use the Strategy Tester. MT5's built-in backtesting tool lets you scroll through historical price data candle by candle. You can simulate reading a chart in real time without risking capital.
Set up multiple time frames. Open the same pair on a daily, 4-hour, and 1-hour chart side by side. Look for confluence — when patterns and levels align across time frames, the signal is stronger.
Mark your levels before the session. Before each trading session, identify your key support and resistance zones on the daily or 4-hour chart. Then drop to lower time frames to look for entry signals.
Keep a chart journal. Screenshot trades you spot — whether you take them or not. Review them after the fact. This is one of the fastest ways to build pattern recognition.
A demo account at Spec Markets gives you full access to MT5 with real market data. You can practice forex chart analysis across all major pairs with a $50 minimum deposit when you are ready to go live.
What is the best chart type for forex beginners?
Candlestick charts. They show the same data as bar charts but in a visual format that makes patterns easier to identify. Most professional traders use candlestick charts as their default.
How long does it take to learn to read forex charts?
You can learn the basics of candlestick anatomy and common patterns in a few hours. Developing reliable chart reading skills through practice typically takes weeks to months of consistent screen time. A demo account helps you build this experience without financial risk.
What time frame should beginners use for forex chart analysis?
Start with the daily and 4-hour charts. They produce cleaner signals and are less affected by short-term noise than 1-minute or 5-minute charts. Once you understand structure and key levels, you can move to lower time frames for entries.
Do I need indicators to read forex charts?
No. Price action trading relies on raw candlestick data, support and resistance, and trend structure. Indicators can add useful context, but they are not required — especially when you are starting out.
What is the difference between support and resistance in forex?
Support is a price level where buying pressure has historically stopped price from falling. Resistance is where selling pressure has stopped price from rising. These levels form the framework for identifying where to look for trade setups.
What are the most reliable candlestick patterns for beginners?
Engulfing patterns and hammers/shooting stars at key support or resistance levels are among the most consistent signals for beginners. Always look for confirmation from the surrounding price context, not the pattern alone.
Can I practice reading forex charts without risking real money?
Yes. A demo account gives you full access to live market charts and MT5 tools with no real capital at risk. Spec Markets offers demo accounts alongside live accounts with a $50 minimum deposit.
Chart reading is a skill. Like any skill, it gets sharper with practice. The concepts in this guide — candlestick anatomy, patterns, support and resistance, price action — are the same tools active traders use every day.
The fastest way to improve is to open charts and start looking. A demo account removes the pressure of real money so you can focus entirely on learning.
Learn more and open your account at specmarkets.com.
Risk disclaimer: Trading CFDs and forex involves significant risk of loss and is not suitable for all traders. Leverage can amplify both profits and losses. You should only trade with capital you can afford to lose. Past performance is not indicative of future results. Please ensure you fully understand the risks involved before trading.